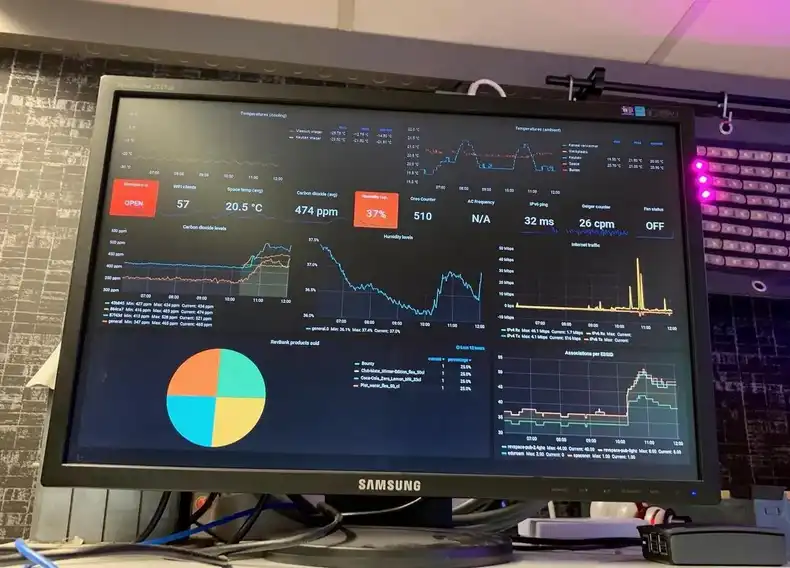
Grafana brands itself as ‘the open platform for beautiful analytics and monitoring.’ Grafana lives up to its claim. With Grafana, you can gather data from 51 data sources, and you can display that data on 1,392 pre-configured dashboards. Important data sources and applications that are compatible with Grafana include Graphite, Elasticsearch, Cloudwatch, InfluxDB, Prometheus, and Hosted Metrics.
Grafana supports a variety of data visualizations, including heat maps, histograms, bar graphs, and geo-maps. When your data falls above or below a certain threshold, you can receive a timely alert via channels such as Slack and PagerDuty. Grafana is also open source, so it’s entirely free to use. The Grafana open source developer community is quite active. The Grafana developer community regularly adds features and quickly fixes discovered bugs.
With Screenly, you can easily display your Grafana dashboards on your digital signs. The ability to display your data is essential, as great dashboards are only useful if your team can see the dashboard data and take action. Displaying Grafana dashboards on your digital displays ensures that your entire team has access to your real-time company metrics with ease. You can find our Grafana support announcement on our blog.
Remote teams can also take advantage of Grafana and digital signs to share company metrics with team members. Even though remote teams will not be able to gather around a large display screen in a central office, teams can still view the same real-time company data on a digital sign. Remote organizations can achieve this functionality by providing each team member with a desktop display screen such as the Raspberry Pi Touch Display. In fact, Screenly’s own team is entirely remote and located around the world. Each team member keeps a desktop digital signage display on their work desk with a playlist of company metrics on Grafana dashboards.
Setting up Screenly with Grafana Real Time Dashboards
To display your Grafana dashboards on your Screenly digital signs, you must take a few additional steps. These extra steps come from the need to authenticate your digital signage with Grafana. In short, you will need to use authorization header data.
Getting your ‘Service Account Token’ from Grafana
Before you get started, you need to get your service account token from Grafana. This is what Screenly uses to authenticate against Grafana. This service account token can be used across multiple screens. This is a more secure way of authenticating with Grafana. This is also true if you are using Grafana Cloud.
To generate a service account token, take the following steps:
Log in to your Grafana account and click on the “Administration” tab in the left-hand menu. Choose “Service accounts” from the “Administration” sub-menu.
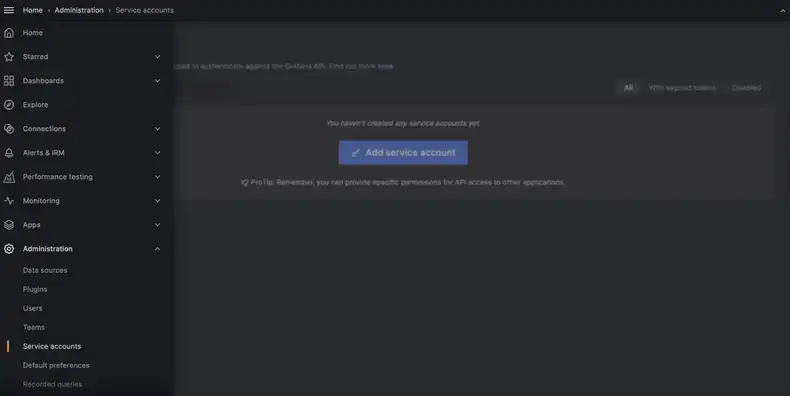
Click on “Add service account”.
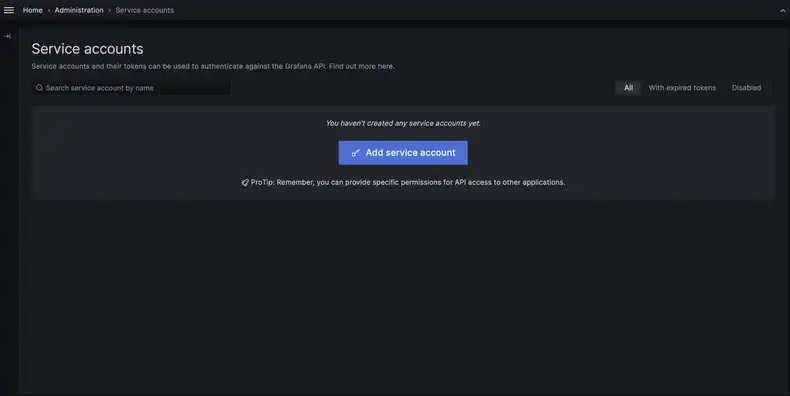
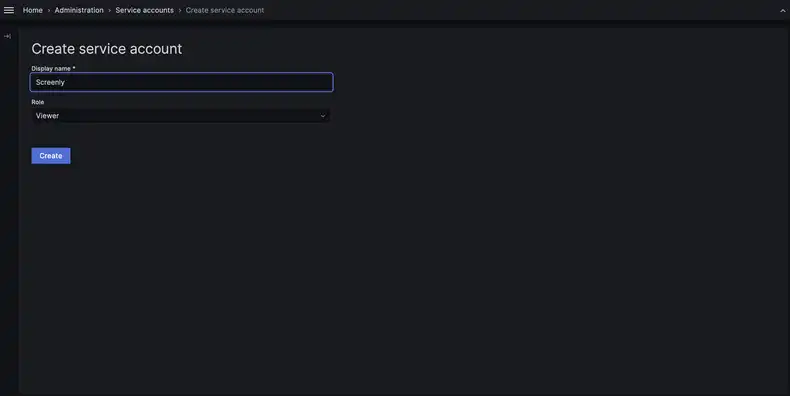
Enter a name for your service account and select “Viewer” as the role. Click “Create” to finish.
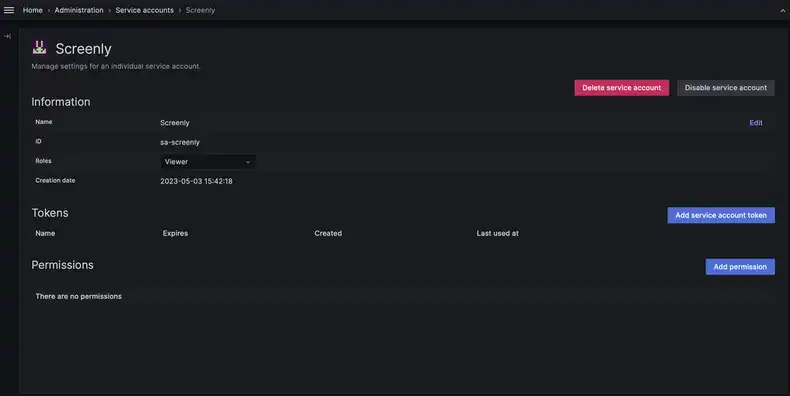
Click on the service account you just created. Click on “Add service account token” in the right part of the screen.
Enter a name for your service account token and click “Generate token”.
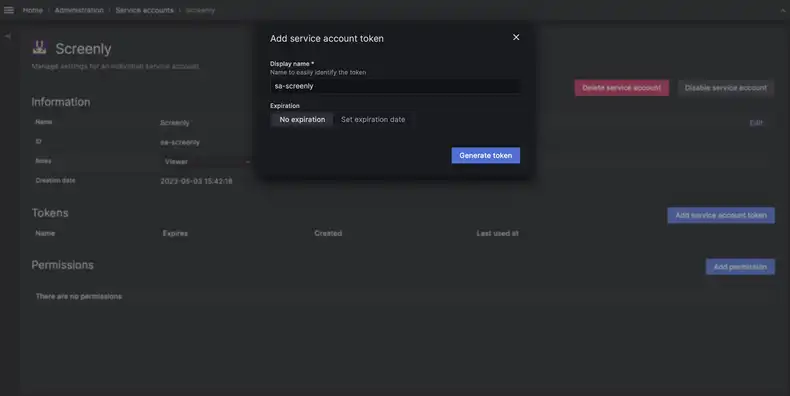
Copy the token and save it somewhere safe. You will need it later.
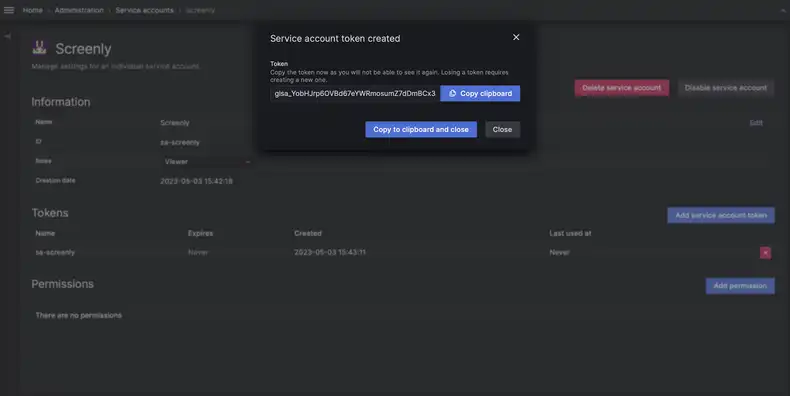
Click “Close” to finish.
Getting your API key from Grafana 5.2 or older (legacy)
If you are using older Grafana version (Grafana 5.2 or older), you need to get your API key from Grafana. This is what Screenly uses to authenticate against Grafana 5.2 or older . This API key can be used across multiple screens.
To generate an API key in Grafana, you need to have administrative permissions. Assuming you have the required permissions, simply log in to your Grafana account and take the following steps:
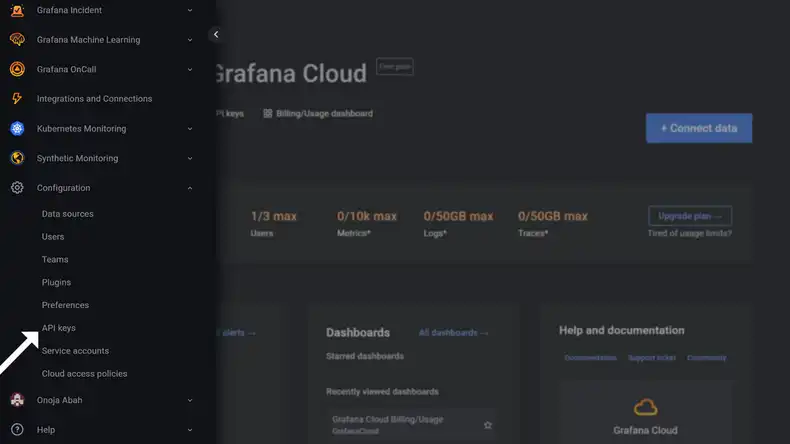
Scroll down in the left-hand menu and click the “Configuration” tab. Choose “API keys” from the “Configuration” sub-menu.
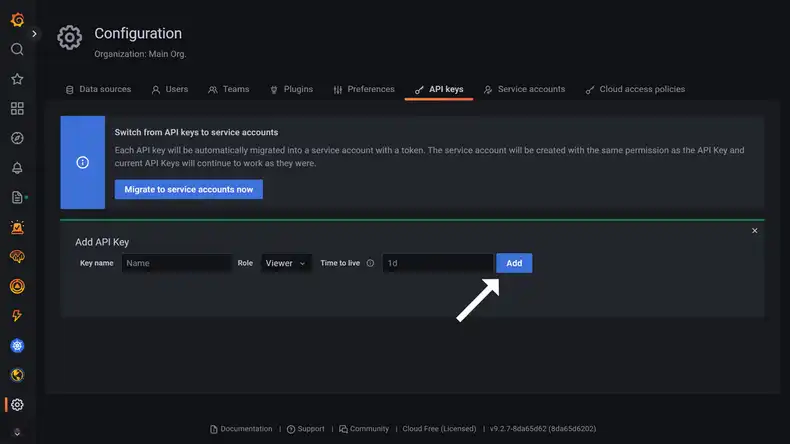
Click on “API keys” in the top right part of the screen. Enter a name for your API key and select “Viewer” as the role. Click “Add” to finish.
You will then get a dialogue window with a command that looks like this:
    $ curl -H "Authorization: Bearer abc123=" \
        https://grafana.yourdomain.com/api/dashboards/home
What you need to take note of here is “Authorization: Bearer abc123=”. You will use this data in Screenly when you are adding your content items.
Adding your Grafana dashboards to Screenly
Adding a Grafana dashboard to Screenly is very straight forward. You can either add an individual chart or an entire dashboard. Once you have identified the Grafana digital dashboard that you want to display, open the dashboard and click on the share icon near the top of the screen. Then, copy the generated URL.
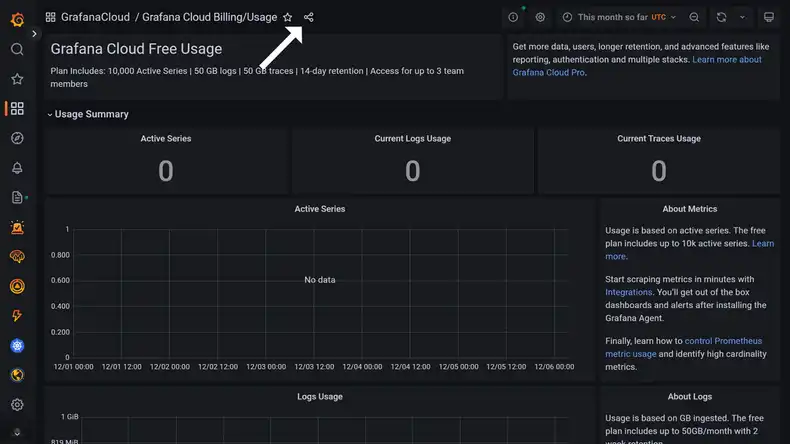
We recommend that you append “&kiosk” to the end of the URL. This will automatically hide the menu bars, which makes for a better viewing experience. With the URL ready, simply add this as an asset to Screenly by following the following steps:
Log in to your Screenly account here. If you do not have a Screenly account, register for a 14-day free trial.
After logging in to your Screenly account, click on the “New” button on the top right of your screen. Then, click on the “Content” tab in the dropdown menu.
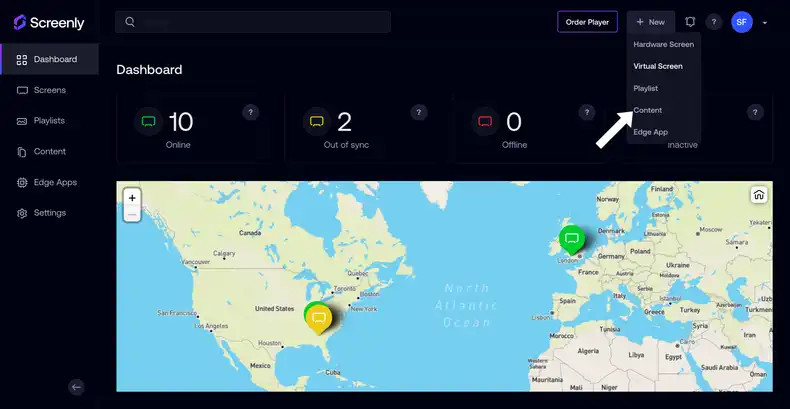
Add the dashboard URL as content to your Screenly account. After you add the asset, you need to add your Grafana credentials. To do this, take the following steps:
Navigate to the URL content item you just added.
Select the “Advanced” link below the content title.
Press the “+ Add Header” button.
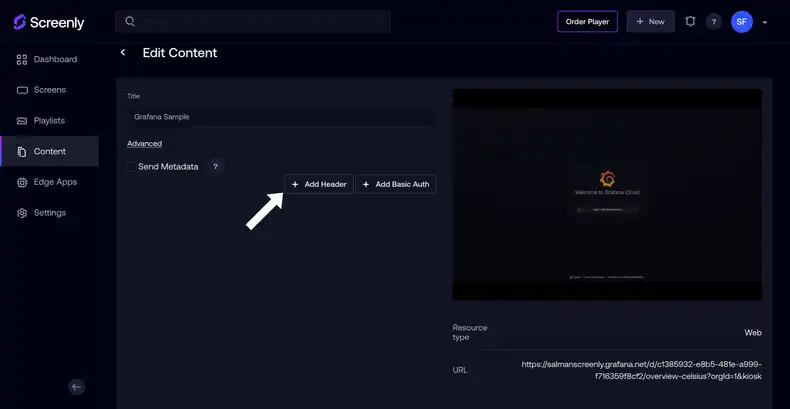
In the “Header” field, enter the text “Authorization”.
In the “Value” field, enter “Bearer abc123=” (replace the “abc123=” part with your token).
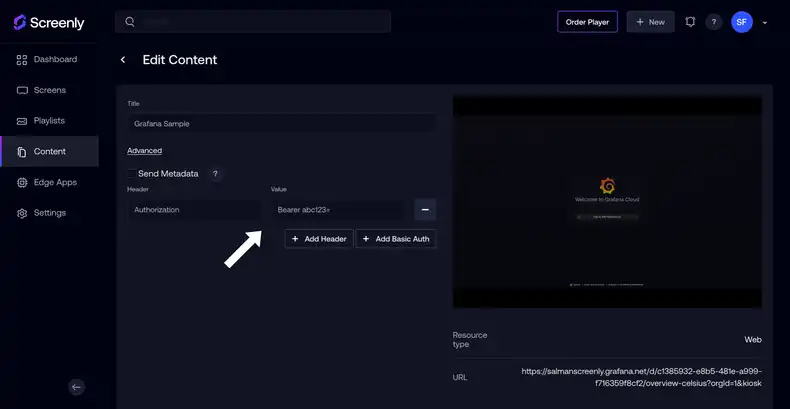
Press the “Save” button on the bottom right.
With the above steps completed, you can now add this asset to your playlist either by editing the playlist or creating a new playlist.
Alternatively, you can also use our CLI to perform the above task. With the Bearer Token, you would then simply do:
$ screenly asset add https://grafana.mydomain.com Grafana
+----------------------------+-------------+------+--------+
| Id                         | Title       | Type | Status |
+----------------------------+-------------+------+--------+
| XXXXXXXXXXXXXXXXXXXXXXXXX  | Grafana     | N/A  | none   |
+----------------------------+-------------+------+--------+
$ screenly asset bearer-auth XXXXXXXXXXXXXXXXXXXXXXXXX abc123=
[...]
If you’re bulk adding Grafana Dashboards, you might also take a look at the Grafana helper Python script on our GitHub Playground.
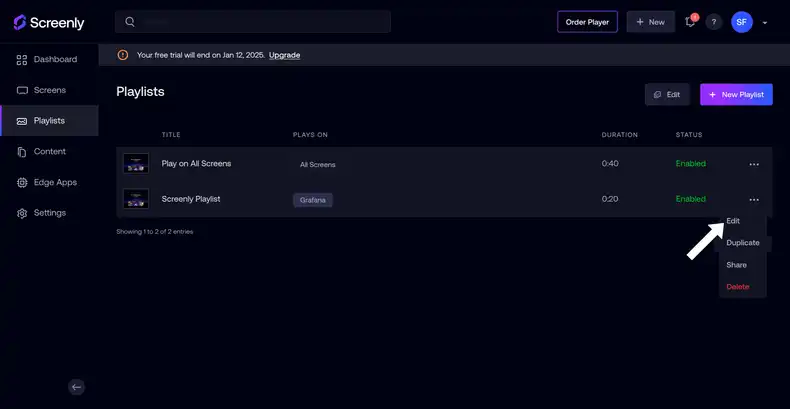
Please note that these dashboards tend to be heavy, so we do not recommend setting the duration to anything less than 30 seconds (set the duration higher if you have multiple graphs).
Tip: When designing your dashboards, it is recommended that you optimize the height and width of your dashboard to 1920x1080px, which is most likely the resolution used by the screen.
Steps for adding an individual graph
First, navigate to the dashboard in Grafana. Next, click on the dashboard title and select “Share”.
Copy the share link and open the link in a new browser tab. Then, modify the time range to the desired range (such as “Last 14 days”).
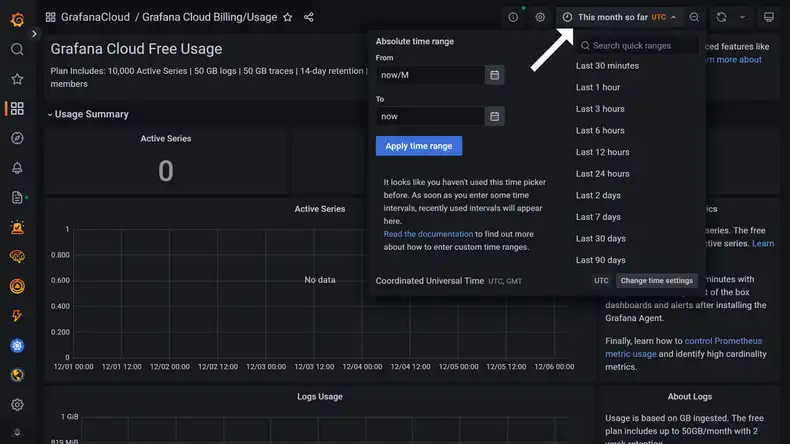
Then, copy the new URL, and append “&kiosk” to the end. Add the URL as an content item in Screenly as described in this video guide.
Add the bearer token credentials to the newly created asset as described above.
After following the steps outlined in this article, you should now have your digital dashboard display up and running on your Screenly digital signs.
If you have any trouble getting your Grafana live dashboards and/or charts to display on your screens, contact Screenly Support at any time. We are always happy to help!
If you do not have a Screenly account, sign up for a 14-day free trial.
